Share

Sportive

Which Strava segment was most popular in 2015?

Do you use Strava? You’re not alone – in fact, a staggering 115,788,472 rides were uploaded in 2015, including 23,126,613 in the UK. They’re two of the stats released by Strava looking back at past year.

Across both cycling and running, 5.3 activities were uploaded to Strava ever second in 2015, with millions of athletes – more than 100,000 sign-up every week – using the app and website to log training, analyse data, plot routes, and track friends (and rivals…).

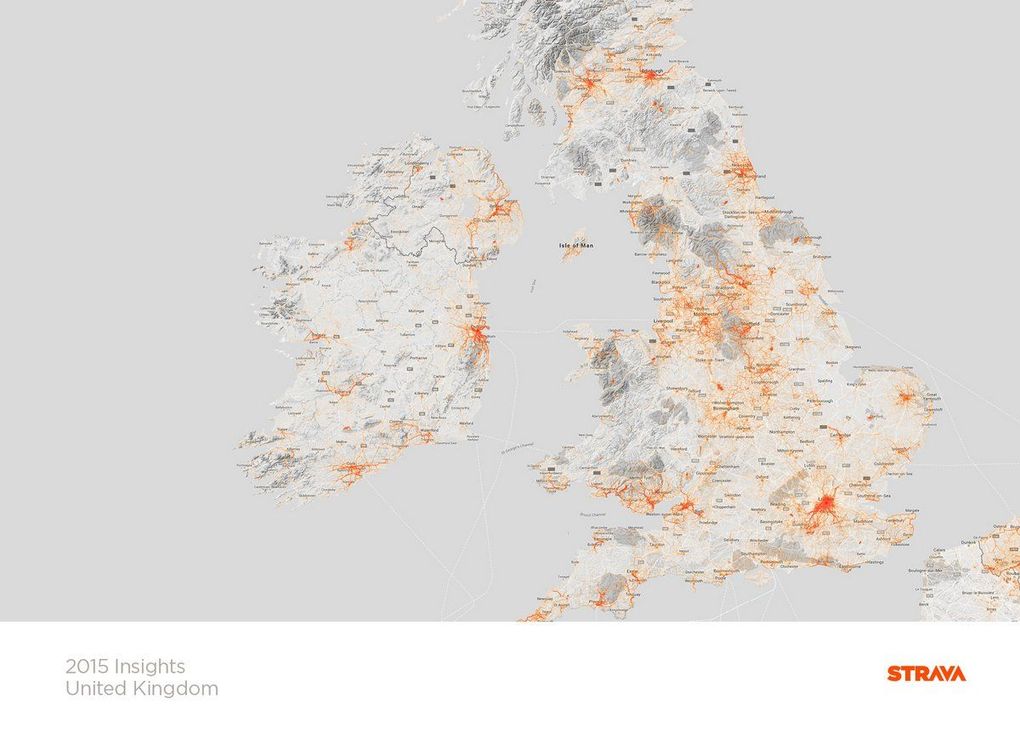
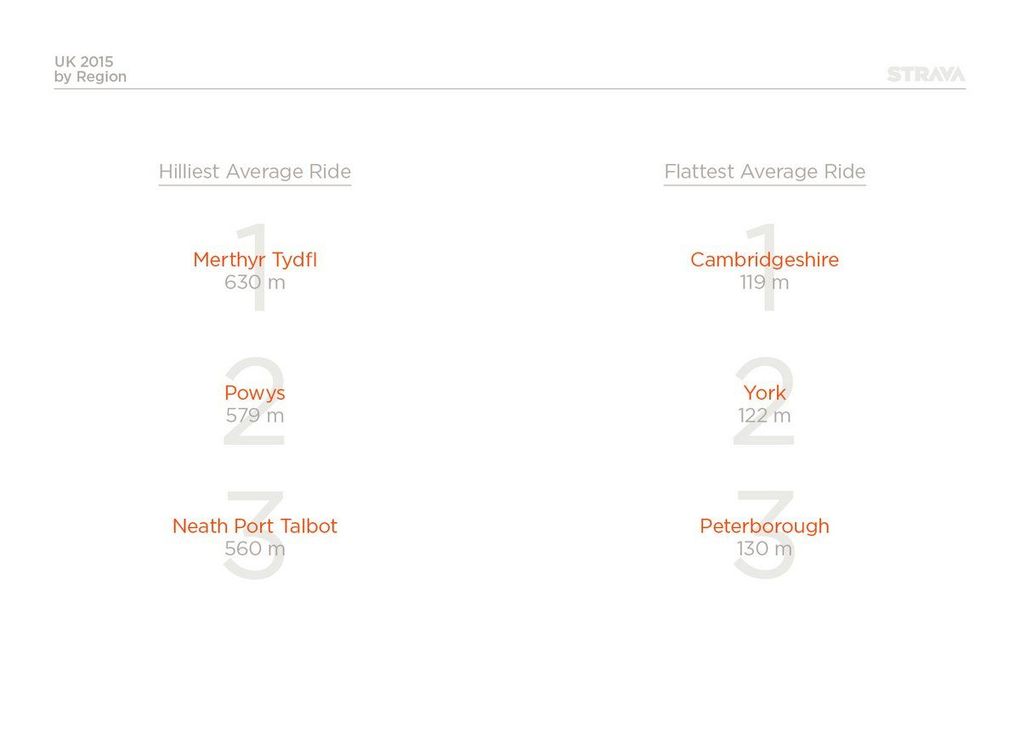
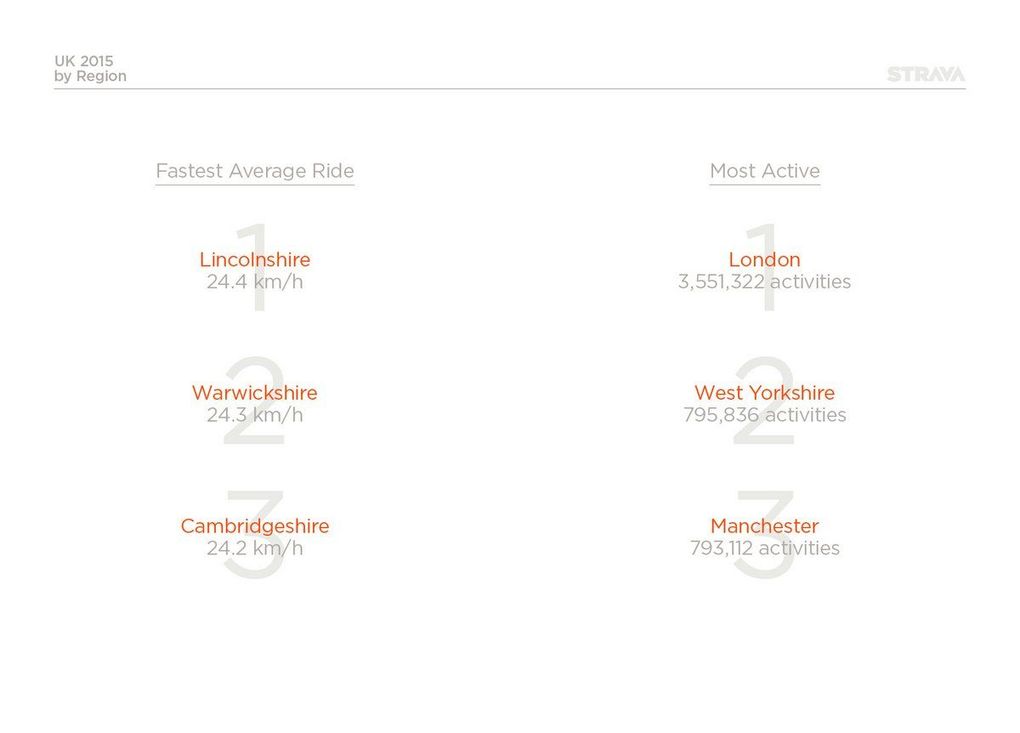
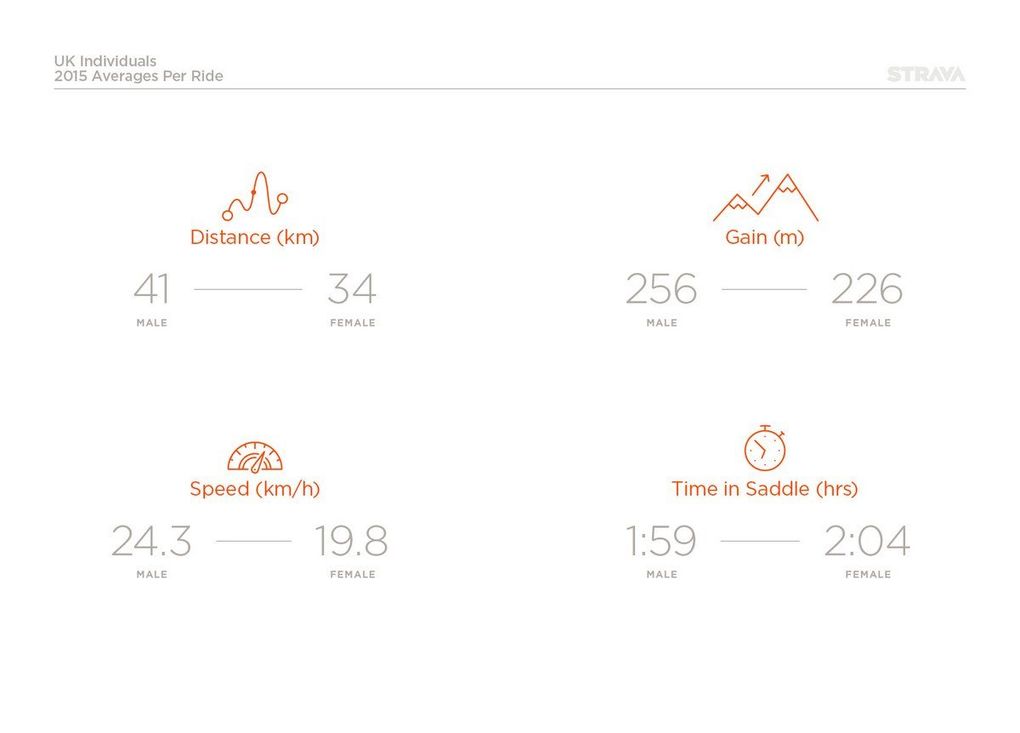
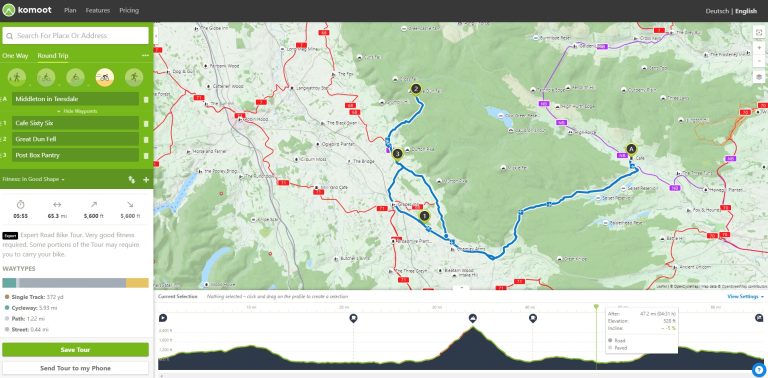
That’s produced a wealth of data, including the UK’s most popular segments, the most active day, the hilliest and flattest areas to ride, average speeds and distance, and plenty more, including what the country’s army of cycle commuters are doing on two wheels.

Some of the data is surprising, some of it less so, but it provides an interesting snapshot into how the UK’s cycling community spends life on two wheels. Here are some of the best bits.

Strava has released an insight into the UK’s cycling community based on 2015 data, including this heat map

The most popular segment

Unsurprisingly, given the population density of the south east, all ten of the most popular segments in 2015 were concentrated in one corner of the country. Perhaps even less unsurprisingly for anyone who’s ridden there, no less than three came in Richmond Park alone.

Three of the UK’s most popular segments are in Richmond Park, which features on the RideLondon-Surrey 100 sportive route (Pic: Roz Jones)

More than 33,000 attempts (33,226 to be precise) were made on the 1.1-mile climb of Sawyers Hill. In truth, it’s not much of a climb, rising at an average of two per cent, but the ramp does pitch up to ten per cent and for London’s cyclists it is, along with the rest of Richmond Park, a small slice of cycling heaven in amongst the hustle and bustle of the capital. It also features on the route of the popular RideLondon-Surrey 100 sportive.

The King of the Mountains title for the segment is ‘held’ by Gabriel Evans, the teenage cyclist who recently admitted to using EPO. Evans recorded an average speed of 43kph on the segment on September 3, 2014.

Otherwise, Box Hill also features in the top ten, along with Leith Hill – both popular climbs for weekend riders, as well as, like Sawyers Hill, featuring on the RideLondon course. See the full top ten below.

1) Full Sawyers Uphill – Richmond Park, London
2) 100Climbs No14 Box Hill – Box Hill, Surrey
3) Hampton Court Drag – Hampton Court, Surrey
4) Coombe Lane to Abinger Hammer – Guildford, Surrey
5) St Leonard’s to Kingston Mini Roundabout – Thames Ditton, Surrey
6) Broomfield Hill 4% Climb – Richmond Park, London
7) Newlands Corner from West Clandon/A246 – Guildford, Surrey
8) 100Climbs No17 Leith Hill – Leigh Hill, Surrey
9) Tour de Richmond Park – Richmond Park, London
10) Ditchling Beacon – Hassocks, East Sussex

The most active day

Sunday June 7 was the most active day for cyclists across the globe, with 4,145,814,539 kilometres (yep, that’s more than four billion kilometres) ridden and 40,621,683,169 metres climbed.

Sunday June 7 saw the most uploads worldwide

Perhaps the most impressive stat, however, is that 731,295 century rides of 100 miles or more were uploaded on that single day alone. Chapeau!

As for UK cyclists, we were busiest on Tuesday June 30 – showing the power of summer to draw cyclists (and particularly commuters) out on their bikes.

A weekday – Tuesday June 30 – proved to be the most active data for UK cyclists

Still, there were plenty of UK cyclists embarking on more that the ride to work, with 131,130 century rides in among the 684,891,474 kilometres logged on June 30.

Hilliest and flattest average rides

Want to climb? Then, judging by Strava’s 2015 stats, Wales is the place to be, with the hilliest average ride recorded in Merthyr Tydfl on the edge of the Brecon Beacons. Every time a rider in Merthyr Tydfl went out on their bike, they averaged 630m of climbing.

Cyclists in Wales average the most climbing per ride, according to Strava. Want to avoid hills? Head to Cambridgeshire


Second in terms of the hilliest average ride comes the mid-Wales region of Powys with 579m, before Neath Port Talbot in south Wales with 560m.

On the flip side, Cambridgeshire is the place to be if you want to avoid climbing, with an average of just 119m of ascent per ride. York comes in second with 122m and Peterborough rounds out the top three with 130m.

Averages per ride

Another of the UK’s flattest areas, Lincolnshire, saw riders record the fastest average speed per ride of 24.4kph, with Warwickshire riders second with 24.3kph and Cambridgeshire cyclists third with 24.2kph.

Unsurprisingly, the flatlands of Lincolnshire helped local riders achieve the fastest average speed

The average distance per ride in the UK was 41km for men and 34km for women, with the average speed across the country 24.3kph for men and 19.8kph for women.

Otherwise, the average ascent per ride was 256m for men and 226m for women, while male riders recorded 1h 59m in the saddle per ride, while female riders clocked 2h 04m.

The average speed for men through 2015 was 24.3kph, with women recording an average of 19.8kph

Of course, averages only provide a snapshot on what’s happening out there.  Laurens Ten Dam is one of the most active pro cyclists on Strava and he logged 24,783km in 2015, spending more than 775 hours in the saddle and climbing more than 300,000m. On the way he recorded 98 KOMs. You can see your own annual Strava stats here: http://2015.strava.com/

Commuting

Given that Tuesday June 30 saw the most uploads from UK cyclists, it’s not surprising that it was also the most popular commuting day (users can mark a ride as a commute when they upload) – 64,319 Strava commutes were made on that day, with a total commuting distance of 1,147,023km recorded.

How long is your ride to work? The UK average is 15.9km, according to Strava’s data

Over the course of the year, the average distance for a commute on Strava was 15.9km, ridden at an average speed of 23.7kph. The average commute time was 39 minutes.

Finally, while an average of 171,576 commute uploads were made per week, the British weather took its toll with fairweather riders seeking other modes of transport through winter, with a Strava commuting decline of 50.6 per cent.

Share

Newsletter Terms & Conditions

Please enter your email so we can keep you updated with news, features and the latest offers. If you are not interested you can unsubscribe at any time. We will never sell your data and you'll only get messages from us and our partners whose products and services we think you'll enjoy.

Read our full Privacy Policy as well as Terms & Conditions.

production